


TAM, SAM, SOM: How to Size a Market for Your UAE Business
Publication date: 04.11.2026
Backers wade through stacks of decks all boasting billion-dollar markets. What lends a TAM, SAM, and SOM estimate any credibility is not a jaw-dropping headline number but a method you can see through and a believable route to winning customers. This guide walks through sizing the opportunity in Dubai and the wider Emirates using sound UAE market research practice.
What TAM, SAM and SOM Mean
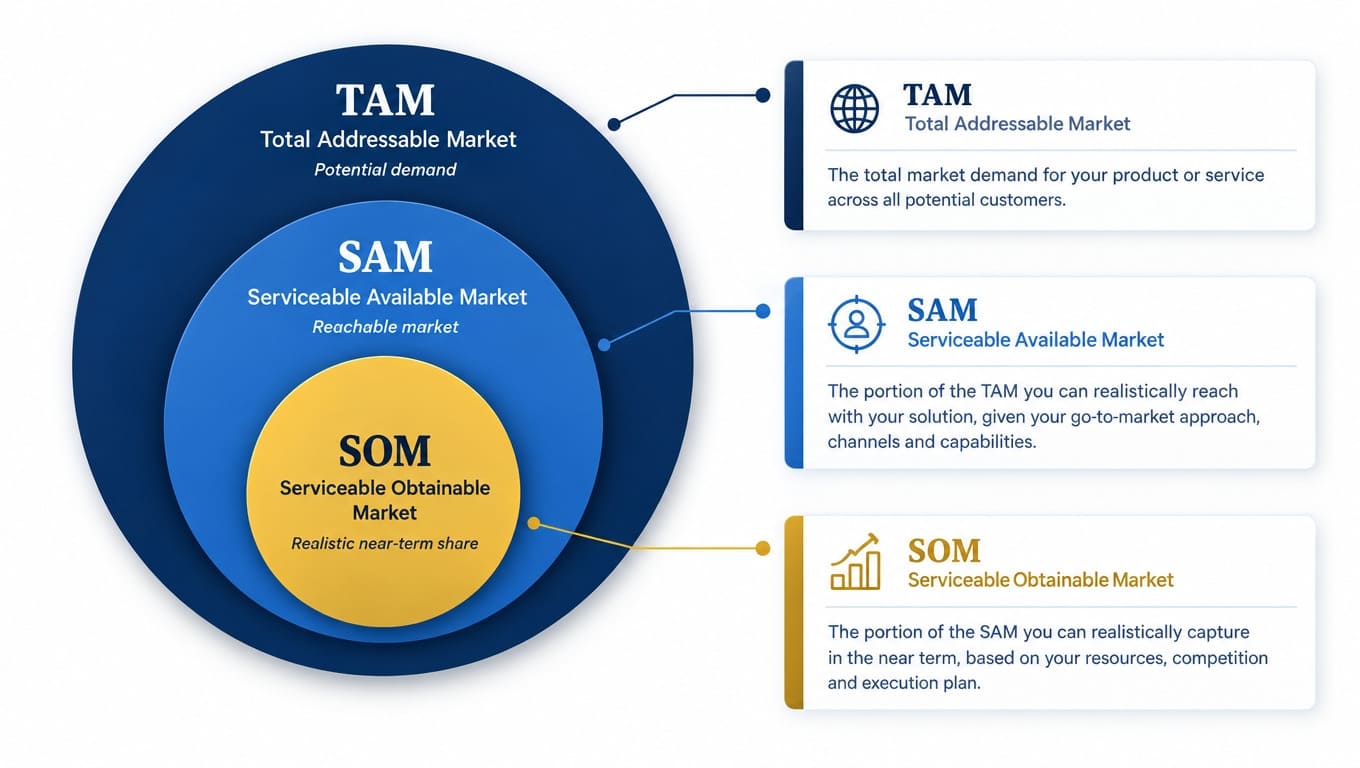
Market sizing takes a sprawling opportunity and slices it into grounded, usable layers. Rather than counting every person or firm in the country as a buyer, the framework strains total demand down to the revenue genuinely within reach.
Grasping the three layers keeps founders from pinning forecasts on fantasy and gives backers a cleaner read on whether a venture actually holds up commercially.
TAM: Total Addressable Market
Total Addressable Market is the outright ceiling of annual demand for your product or service category, imagining a world where nothing — no operational, geographic, or competitive hurdle — stood in your way.
It is not the whole global economy, nor every dirham spent across some broad sector. For a company trading in the United Arab Emirates, TAM should capture the yearly value of the specific problem you solve, inside the geographic and regulatory lines you could in theory reach.
SAM: Serviceable Available Market
Serviceable Available Market is the slice of TAM you can realistically go after today. It reckons with your actual product shape, your price, your routes to market, your delivery logistics, and how far your licence lets you operate.
If what you sell is a premium B2B SaaS tool aimed only at English-speaking law firms on the Dubai and Abu Dhabi mainland, your SAM leaves out every company beyond those sectors, locations, and price brackets.
SOM: Serviceable Obtainable Market
Serviceable Obtainable Market is the realistic share of SAM you can actually take inside a set window, usually the coming one to three years.
It bows to the constraints you really face: the marketing budget, how much your sales team can carry, how well your brand is known, how much you can produce, and the ground already held by entrenched rivals.
A Dubai Healthy Meal Subscription Example
To see how the layers tighten a market, picture a direct-to-consumer healthy meal-plan startup based in Dubai:
- TAM is the total yearly outlay on packaged health-conscious food, meal-prep kits, and wellness meal plans across the entire United Arab Emirates.
- SAM pares that down to urban professionals and fitness-minded residents in Dubai and Abu Dhabi who can afford a recurring monthly subscription and sit inside the company’s refrigerated delivery zones.
- SOM sets the precise count of active monthly subscribers the startup can win and hold over its first twelve months, given its kitchen throughput, delivery fleet, and marketing spend.
A believable market read travels from broad consumer appetite down to what you can actually cook and deliver. Never mistake total food spending for demand aimed at one specialized subscription.
How to Calculate TAM, SAM and SOM
Solid sizing leans on checkable inputs, assumptions stated out loud, and one consistent measurement window. You can work out the figures top-down, bottom-up, or by pairing both.
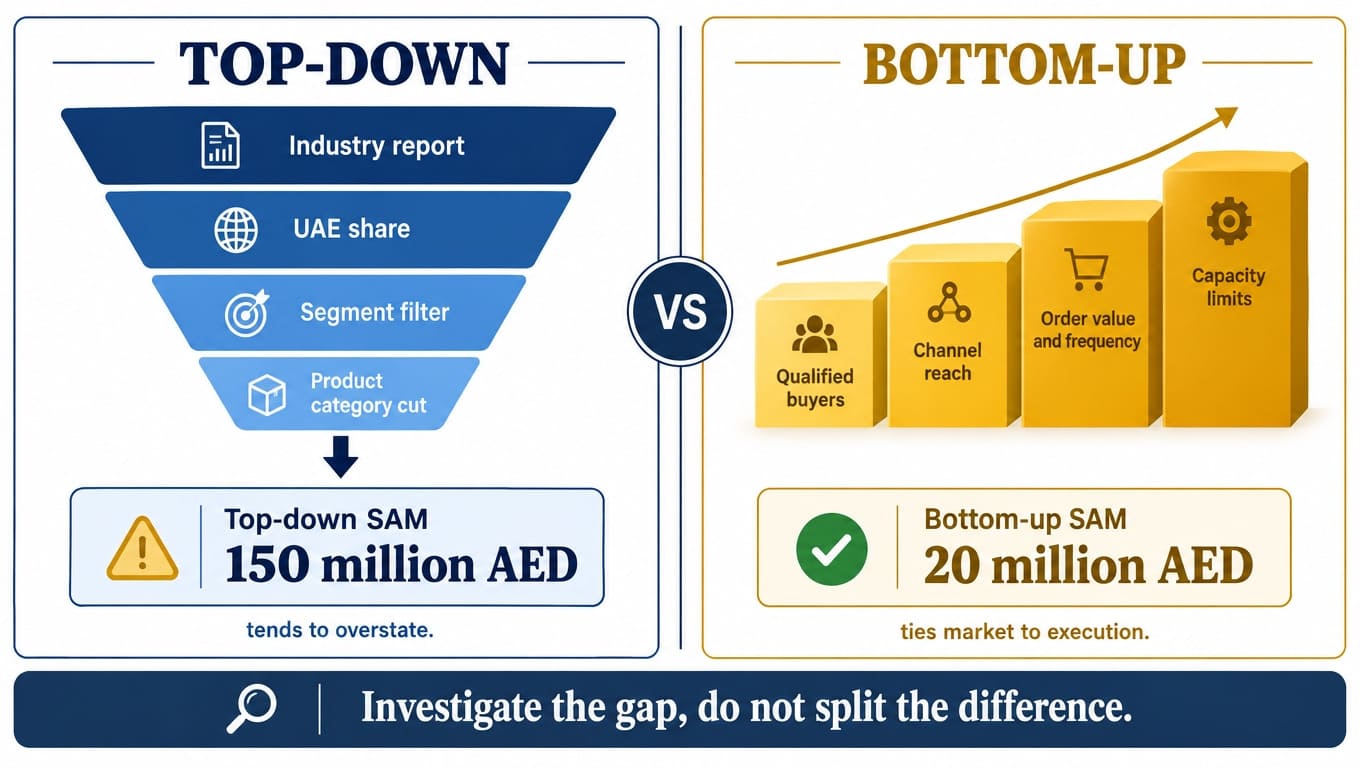
Top-Down Market Sizing
Top-down opens with macro industry data and layers on successive percentage filters to carve out your target slice.
You begin with a recognized report on the overall market, pull out the United Arab Emirates portion, screen by the demographic or enterprise traits that matter, and apply the cut that belongs to your product category.
- Upsides: It moves quickly, draws on established secondary research, and hands you an instant macro view for early pitch conversations.
- Downsides: It tends to inflate the opportunity, since founders lop off broad, unproven percentages without ever showing how customers actually convert.
Bottom-Up Market Sizing
Bottom-up builds the estimate up from unit economics and real local customer counts, fixing on the mechanics of how revenue appears:
- Count the qualified buyers sitting in your target niche.
- Work out what share of them your marketing and sales channels can actually touch.
- Set the average order or contract value per transaction.
- Multiply by how often they buy across a year.
- Fold in the limits — delivery volume, support staffing, inventory turnover.
This route asks for deeper digging and granular local data, yet it lands far harder with backers because it ties the market straight to how you execute commercially.
Compare the Two Methods
For an assessment that holds water, run the numbers both ways, top-down and bottom-up.
If top-down puts SAM at 150 million AED while bottom-up surfaces a reachable market of just 20 million AED, resist splitting the difference. Dig into where they part ways. Test whether the top-down filters ran too loose, or whether the bottom-up price, buying frequency, or customer count was wound too tight.
Worked Market Sizing Example for a UAE Business
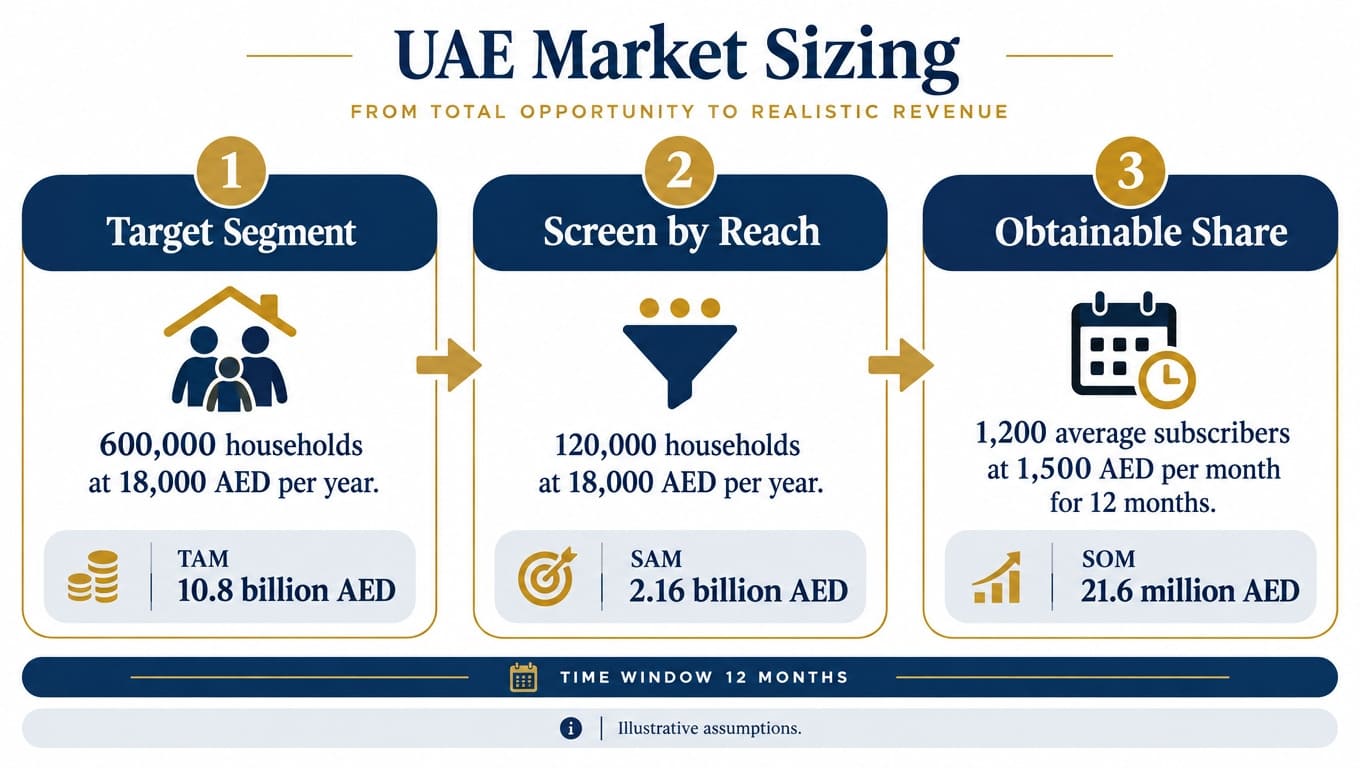
Here is a hands-on bottom-up walkthrough for a premium healthy meal subscription covering Dubai and Abu Dhabi. Every figure is an illustrative assumption, there to show the mechanics.
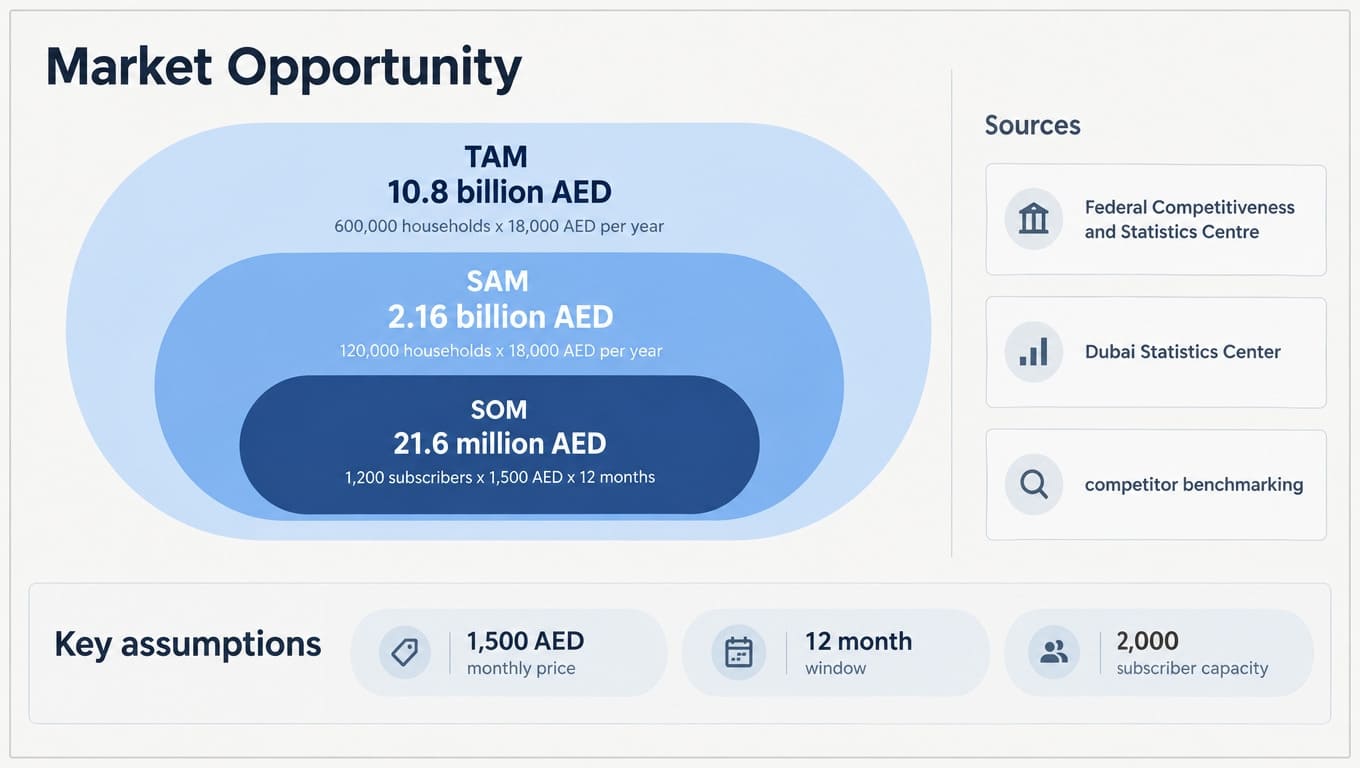
- TAM: Assume 600,000 households across the UAE earning over 25,000 AED a month, each spending on average 18,000 AED a year on specialized health food and wellness dining. Multiply 600,000 by 18,000 AED and TAM lands at 10.8 billion AED.
- SAM: Screen for Dubai and Abu Dhabi households already using daily meal delivery, put at 120,000. At 18,000 AED a year per customer, SAM comes to 2.16 billion AED.
- SOM: With an opening marketing budget, two dispatch hubs, and kitchen capacity capped at 2,000 active daily subscribers in year one, the company aims to climb from 200 subscribers in month one to 2,000 by month twelve.
- Revenue Reconciliation: A steady-state average of 1,200 paying subscribers across the first year at 1,500 AED a month throws off 21.6 million AED in real first-year revenue — roughly 1% of SAM.
- Feasibility Check: Line up customer acquisition cost, kitchen shift capacity, and rider coverage against that 2,000-subscriber goal to confirm the marketing and operational resources actually match the SOM.
UAE Market Sizing Data Sources
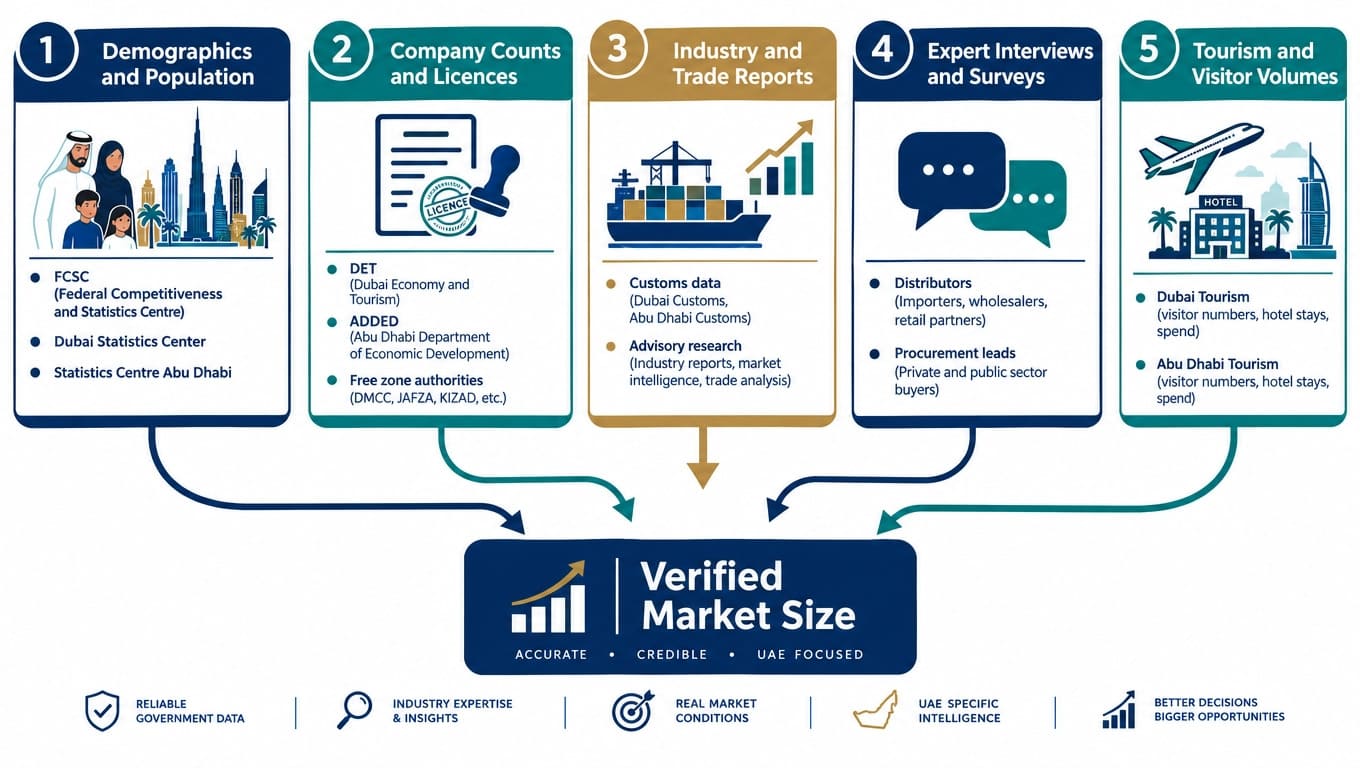
Accurate sizing calls for verified local data, not global stand-ins. A professional UAE market research process pulls from a spread of public and commercial repositories.
Population, Demographics and Tourism
Official demographic figures set the baseline for consumer sizing. When you gauge consumer demand, lean on the Federal Competitiveness and Statistics Centre (FCSC), the Dubai Statistics Center (DSC), and Statistics Centre Abu Dhabi (SCAD).
Keep in mind that spending in the Emirates leans heavily on non-residents. In hospitality, wellness, luxury retail, and transport, tourists and business travelers make up a sizeable share of addressable transactions.
Company Counts and Business Licences
For B2B plays, the sizing foundation sits on active commercial licences. Pull data from economic development portals such as the Dubai Department of Economy and Tourism (DET), the Abu Dhabi Department of Economic Development (ADDED), and the individual free zone authorities.
Do not take every registered licence for a live B2B prospect. Sieve the totals by activity code, paid-up capital signals, operating status, and company size to strip out holding vehicles and dormant shells.
Industry, Trade and Commercial Reports
Customs figures, import-export records from UAE trade portals, and specialist work from international advisory firms give you hard volume data for physical goods and enterprise services. Whenever you cite a report, note the exact publication date, what it covers, and whether the numbers track local consumption or re-export trade.
Expert Interviews and Surveys
Where secondary data for a tight niche runs thin or stale, go to the source. Structured conversations with local distributors, procurement leads, and sector consultants surface a realistic feel for willingness to pay, supplier margins, and the gaps no one is serving.
UAE Factors That Can Distort a Market Size Analysis
Off-the-shelf sizing templates built for uniform Western markets often come apart in the Emirates. You have to bend the maths to the market’s distinctive structure.
- Regional Concentration: Dubai and Abu Dhabi soak up the lion’s share of commercial spending and high-income demand. Smearing one nationwide figure across all seven emirates warps both operational planning and acquisition costs.
- Income Stratification: The population is varied, with wide gaps in household income, nationality mix, and buying habits. Never stretch a single average order value across every resident.
- Seasonal Fluctuations: Commercial life swings with the calendar. Summer heat, school-holiday departures, Ramadan retail rhythms, and the winter tourism peak all carve out real quarter-to-quarter revenue swings.
- Regional Expansion Sequencing: If domestic demand for your product is slim, weigh a broader Middle Eastern push through formal business strategy development. Hold GCC prospects apart from your opening UAE SAM until you hold the regulatory clearance and logistics to serve those countries.
Common Market Sizing Mistakes
Founders routinely torch their own credibility in the room through sizing slips they could have dodged. Grounding the numbers in realistic business planning protects both your valuation and the story you tell.
- Passing off a global industry valuation as your local TAM without screening for regional fit.
- Promising to simply grab 1% of a multi-billion-dollar market with no marketing plan or channel model behind it.
- Leaning on stale figures lifted from secondary articles instead of primary statistical sources.
- Blending volume metrics such as unit shipments with annual recurring software revenue.
- Waving away incumbents who already own the distribution channels and the customer’s attention.
- Forecasting SOM revenue beyond what your production, logistics, or hiring can bear.
- Stitching together datasets that run on clashing definitions, currencies, or reporting periods.
So your pitch can withstand institutional investment due diligence, set these two approaches side by side:
Weak sizing:
- The Middle East food and beverage market is worth 50 billion dollars.
- We only need 0.5% of it to clear 250 million dollars in revenue.
- Our addressable market is everyone who eats lunch in the UAE.
Credible sizing:
- Pinpoints 120,000 target households in Dubai and Abu Dhabi that meet specific income criteria.
- Confirms a 1,500 AED monthly price through competitor benchmarking and direct customer interviews.
- Sets a year-one SOM of 2,000 active subscribers, bounded by kitchen capacity and verified acquisition economics.
A One-Minute Investor Checklist
Before you lock the deck slide or the strategy document, run the numbers through this business analytics checklist. Founders gearing up to raise can also work through our full guide to raising startup funding in the UAE.
- Spell out which product categories and geographies sit inside TAM and which are left out.
- Break TAM, SAM, and SOM apart by geography, customer profile, and time window.
- Give the publication date and exact source for every demographic or economic figure.
- State the formulas, pricing assumptions, and purchase-frequency metrics plainly.
- Check top-down estimates against a bottom-up unit-level build.
- Show that the SOM fits your marketing budget, headcount, and delivery limits.
- Keep proven historical data apart from forward-looking company assumptions.
- Lay out the final slide so a backer can follow the logic, sources, and maths inside a minute.
Get a UAE Market Research Study
Sound market sizing underpins every launch, pivot, and funding round that works. When public data in your niche is patchy, or you are weighing a push across the UAE and the GCC, bespoke research brings the clarity that strategic capital decisions demand.
Aser Capital runs targeted market research, competitive mapping, and bottom-up opportunity assessments for companies entering or scaling in the United Arab Emirates. Get in touch with our advisory team to talk through a dedicated study shaped around your commercial goals.
Frequently Asked Questions
What should you do if your top-down and bottom-up market estimates show completely different numbers?
Do not just split the difference between the two. Dig into where they diverge instead, checking whether the top-down demographic filters ran too loose or whether the bottom-up pricing, customer count, or purchase-frequency assumptions were wound too tight.
Why is counting all registered commercial licences misleading when sizing a B2B market in the UAE?
Not every registered licence is a live prospect. Full registry counts routinely sweep in holding vehicles and dormant companies, so you have to filter by operating status, specific activity codes, company size, and paid-up capital.
Can GCC regional expansion be folded into an initial UAE Serviceable Available Market?
Keep regional GCC prospects separate from your opening Serviceable Available Market. Bring the broader Middle East in only once the business holds the regulatory approvals, local partnerships, and logistics to serve those countries.
Why do backers reject decks claiming a startup will simply capture one percent of a market?
Laying claim to an arbitrary slice of a huge sector with no operational model behind it rings hollow. Backers expect the obtainable market to rest on verified acquisition costs, a real marketing budget, kitchen or production capacity, and a believable read on what the sales team can push through.
How do seasonal cycles in Dubai and Abu Dhabi affect sizing calculations?
Demand in the Emirates swings sharply quarter to quarter on summer heat, school-holiday travel, Ramadan retail patterns, and winter tourism. Models have to reflect those shifts rather than assuming the same revenue every month.
How should non-resident visitor spending be handled in consumer sizing?
In consumer fields like wellness, luxury retail, hospitality, and transport, tourists and business travelers account for a meaningful share of addressable transactions. Models should pair official resident demographics with verified visitor-volume data rather than resting on household counts alone.
Similar services




Recent Posts