


How to Build a Financial Model That Wins Investors
Publication date: 03.11.2026
Forecasts with nothing behind them can sink a pitch in seconds, while a model built to stand up to scrutiny signals both strategic clarity and operational control. Draft your financials with professional business planning services, and you hand analysts and lenders tangible evidence that your venture can scale on a predictable curve, spend capital with discipline, and return something measurable.
What Makes a Financial Model Investor-Ready?
Pitching to venture funds, angel groups, or lending banks, founders often treat a lively sales spreadsheet as the finished article. A column of hopeful revenue targets tells no one how the business actually runs. A proper model is a numerical mirror of your whole operating machine, converting commercial strategy, pricing choices, hiring plans, and payment terms into accounting outputs that reveal whether the enterprise can last and pay off.
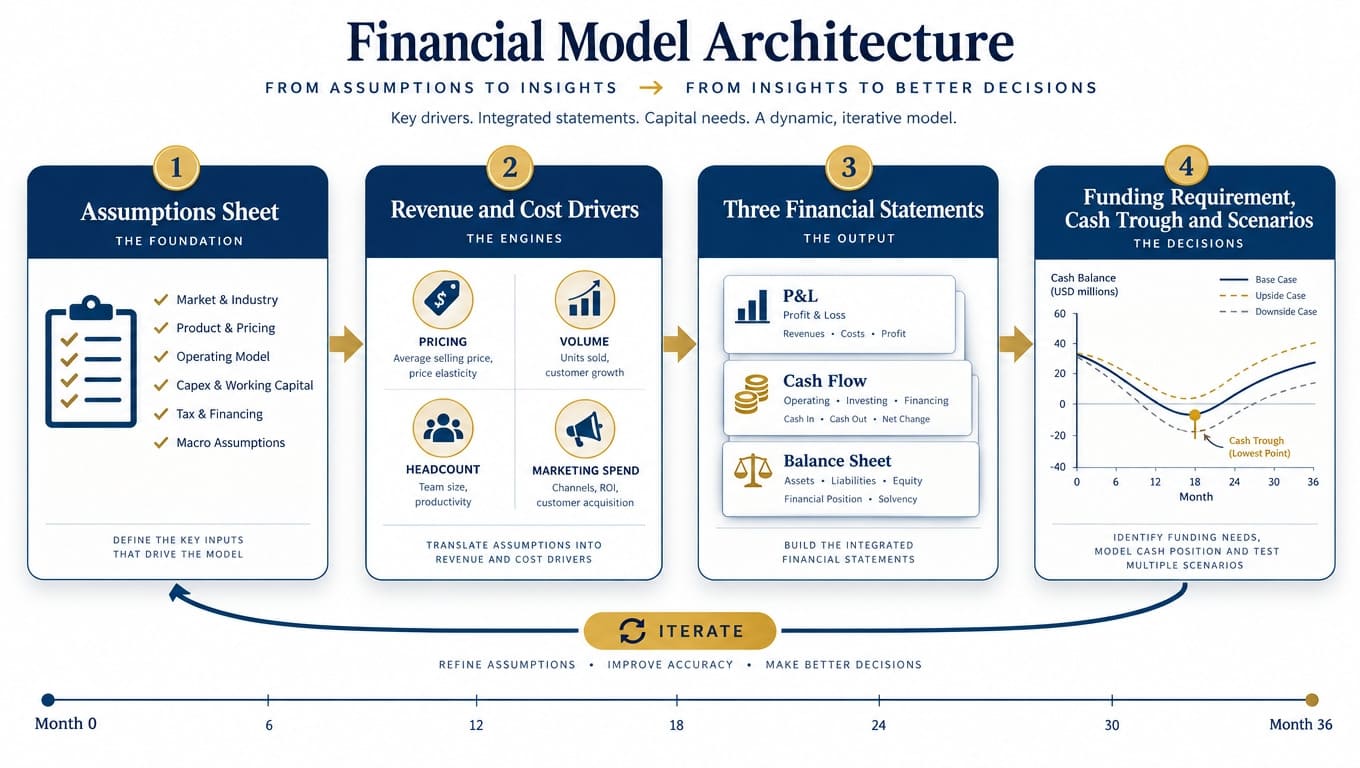
The work pays dividends well before you face an investment committee. It clarifies whether the idea holds together operationally, puts a figure on the capital you need at the outset, and charts the precise points on the road to cash flow breakeven. A deck lays out the vision and the opportunity; a business plan spells out how you execute; the model is the arithmetic backbone tying both together.
Above all else, a model that is ready for backers is one that can be audited. Analysts and credit officers probe by pulling a model apart — tracing the reasoning behind each formula, following every cost back to the assumption it springs from, and checking whether your milestones square with working capital demands. Spot a hardcoded figure buried in a forecast tab, or revenue climbing with no matching lift in headcount or marketing, and trust evaporates.
A sturdy model is not about parading big future profits. It forges a traceable link between what goes into the business and what comes out financially. Once every number ties back to a documented driver, the model turns into a fundraising asset rather than a soft spot waiting to be exposed in diligence.
The Core Structure of a Financial Model
Start with a Clear Assumptions Sheet
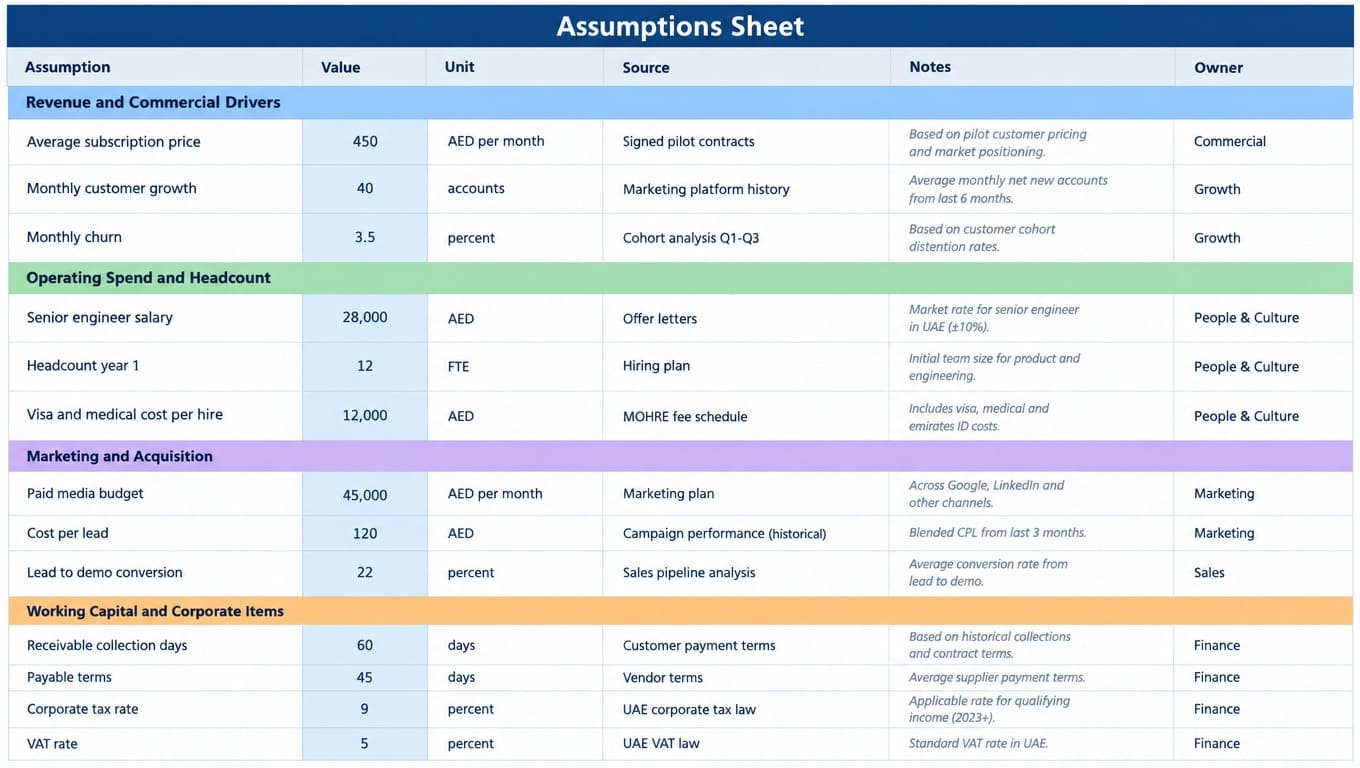
Any workable model opens with a dedicated assumptions tab — the control room for the entire workbook. Nudge one driver here, whether acquisition cost, conversion rate, or a monthly subscription price, and the shift should ripple on its own through every schedule and statement, with no hand-editing anywhere else.
Sort your assumptions into logical operational clusters so the layout stays easy to follow:
- Revenue and Commercial Drivers: base pricing tiers, transaction volumes, monthly customer growth, renewal rates, churn, and how quickly payments land.
- Operating Spend and Headcount: roles, target start dates, base pay, statutory benefits, recruitment fees, visa costs, and office rent.
- Marketing and Acquisition: paid media budgets, channel conversion figures, cost per lead, commission plans, and agency retainers.
- Working Capital and Corporate Items: receivable collection days, payable terms, inventory turnover, VAT rates, and corporate tax provisions.
Resist typing forward-looking numbers straight into calculation tabs. Where the forecast works out customer-service pay in year three, that formula has to reach back to the headcount schedule and the assumptions page.
Each assumption needs a documented basis. Log where every variable came from in a notes column alongside it. Solid sources run from past accounts and signed supplier deals to historical conversion data off your marketing platforms, customer interviews, or validated industry figures gathered through professional market research services. Keep confirmed historical data visibly apart from forward management estimates, and name who on the team owns updating each figure.
Connect the Three Financial Statements
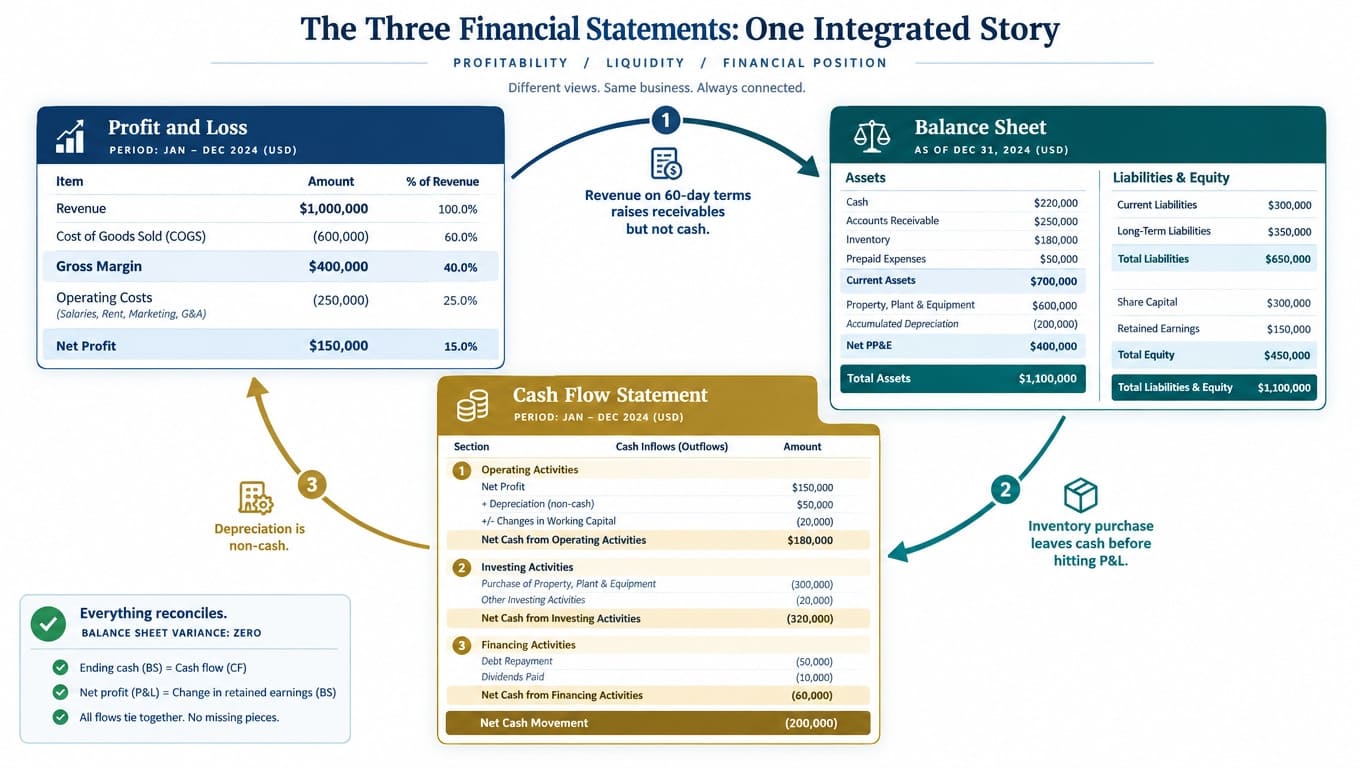
A dependable model has to knit together three linked reports: the profit and loss statement, the cash flow statement, and the balance sheet. Wiring all three as one ensures operating choices flow correctly into liquidity, working capital, and company equity.
- Profit and Loss Statement (P&L): Lays out revenue, cost of goods sold, gross margin, operating costs, and the resulting profit or loss across each reporting window. It speaks to accounting profit, not to the cash actually in hand.
- Cash Flow Statement: Follows money physically moving in and out, split across operating, investing, and financing activity. It strips non-cash items such as depreciation back out of net profit and picks up working-capital swings like late collections or vendor prepayments.
- Balance Sheet: Snapshots assets, liabilities, and shareholders’ equity at each period’s close, keeping the books balanced while tracking cash, receivables, inventory, accrued liabilities, and retained earnings.
Tied together, the three behave as a live loop. Say sales surge on 60-day terms: the P&L shows revenue rising at once, yet the cash flow statement registers nothing until the invoice clears, and the balance sheet simultaneously logs a jump in receivables. Order inventory months ahead of a sale, and the cash leaves immediately on the cash flow statement while the balance sheet carries a larger asset, even though nothing has yet hit the P&L. Linking the statements stops founders from committing the classic error of mistaking accounting profit for money in the bank.
Add Funding Requirements and Use of Funds
Your model owes backers clear answers to two plain questions: precisely how much capital the business needs, and how that money gets spent over time.
To pin down the real requirement, find the deepest point of cumulative negative cash in your integrated cash flow — the cash trough. That low point marks the smallest equity injection you can get away with before incoming cash carries the company itself. Layer on a sensible cushion of three to six months of operating costs to absorb slow collections or a drawn-out launch.
Split one-off capital outlays — manufacturing tooling, software architecture, opening fit-outs — from the recurring burn of payroll and monthly media spend. Tie each deployment of capital to a concrete milestone: finishing the product, clearing a licence, pushing into a neighboring market, or reaching breakeven on cash.
Keep the capital requirement distinct from what the company is worth. The requirement is the operating cash needed to run the plan; valuation is what the market puts on the enterprise. Founders wanting to see how the two interact can draw on professional advisory around business and asset valuation so dilution stays in step with market reality.
How to Build a Credible Revenue Forecast
Use a Bottom-Up Revenue Forecast
Few things burn institutional credibility faster than a top-down forecast. Claiming you will grab one percent of a ten-billion-dollar market says nothing about how the thing actually works. It skips over how the pipeline moves, how much marketing it takes to spin up leads, and how many support staff it takes to hold the accounts together.
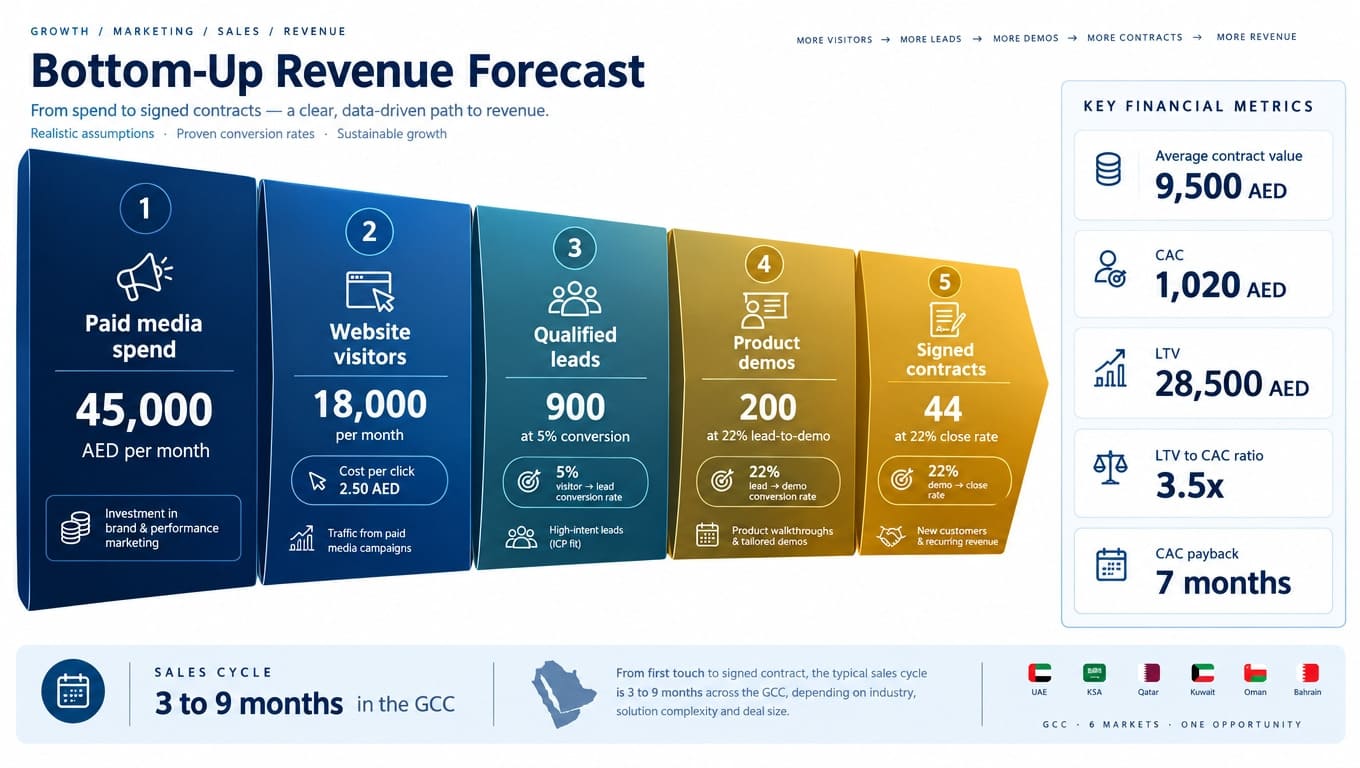
Build the forecast the other way around, from the ground up. A bottom-up approach assembles the numbers straight from fine-grained operating drivers:
- Lead Generation, Inbound and Outbound: monthly ad spend over cost per click yielding site visits, or the outreach volume from dedicated business-development reps.
- Funnel Conversion: visitors turning into qualified leads, leads into demos, and demos into signed contracts.
- Deal Parameters: average contract value, typical order size, how often you bill, and payment timing.
- Retention Behavior: monthly churn, upsell pace, and account-expansion rates.
For enterprise B2B, bake in realistic sales cycles, which across the Middle East frequently run three to nine months. Respect team limits too; one account executive cannot juggle an endless stack of live enterprise deals. Treat total-market data purely as a top-level reality check that your projected share stays sane, never as the engine driving the revenue line.
Link Revenue to Unit Economics
A commercial model only lasts on sound unit economics. At the early stage, yours has to put hard figures on customer acquisition cost (CAC), customer lifetime value (LTV), and the stretch of time it takes to earn back what you spent to win a customer.
- Customer Acquisition Cost (CAC): Pool every marketing outlay, agency fee, direct sales salary, and commission, then divide by the fresh customers landed in the period.
- Customer Lifetime Value (LTV): Take the average gross margin per customer per period and multiply it by how long a customer typically stays, with retention and churn factored in.
- CAC Payback Period: Work out how many months of gross profit it takes to claw back the upfront cost of acquiring that customer.
Backers lean on these numbers to gauge how efficiently you turn capital into growth. Fast growth riding on broken unit economics goes nowhere. Do not let the model pretend acquisition cost sits still while revenue multiplies tenfold; as the easy segments dry up and you fight for customers in pricier channels, CAC usually climbs. Build in the extra support, account managers, and infrastructure needed to keep customer-success numbers steady as you scale.
Why Cash Flow Matters More Than Paper Profit
A company can post a healthy net profit on its P&L and still run dry and fold. The contradiction comes from timing: revenue books when you deliver or invoice, yet costs, supplier bills, and wages demand real cash right away.
Across the United Arab Emirates and the wider GCC, terms often stretch to 60, 90, even 120 days. When clients drag out settlement while rent, cloud providers, and salaries all fall due on the first of the month, a sharp cash gap opens up.
That is why a detailed cash flow projection is non-negotiable. Model cash month by month for at least the opening 24 to 36 months, pegged to actual settlement dates rather than tidy monthly revenue lumps.
Keep a close eye on burn and runway:
- Gross Burn Rate: everything spent on operations in a single month.
- Net Burn Rate: the shortfall between cash going out and operating cash coming in.
- Runway: cash on hand divided by monthly net burn, telling you exactly how many months you can run before fresh money is required.
Institutional backers watch burn and runway like hawks. The pair measure how much pressure the clock puts on you and how long management has to prove the commercial case before the cash is gone. Fold in a solid break-even analysis to show the exact volume and gross profit needed to cover fixed overheads, giving backers a clean read on the downside.
Build Scenarios and Test What Could Go Wrong
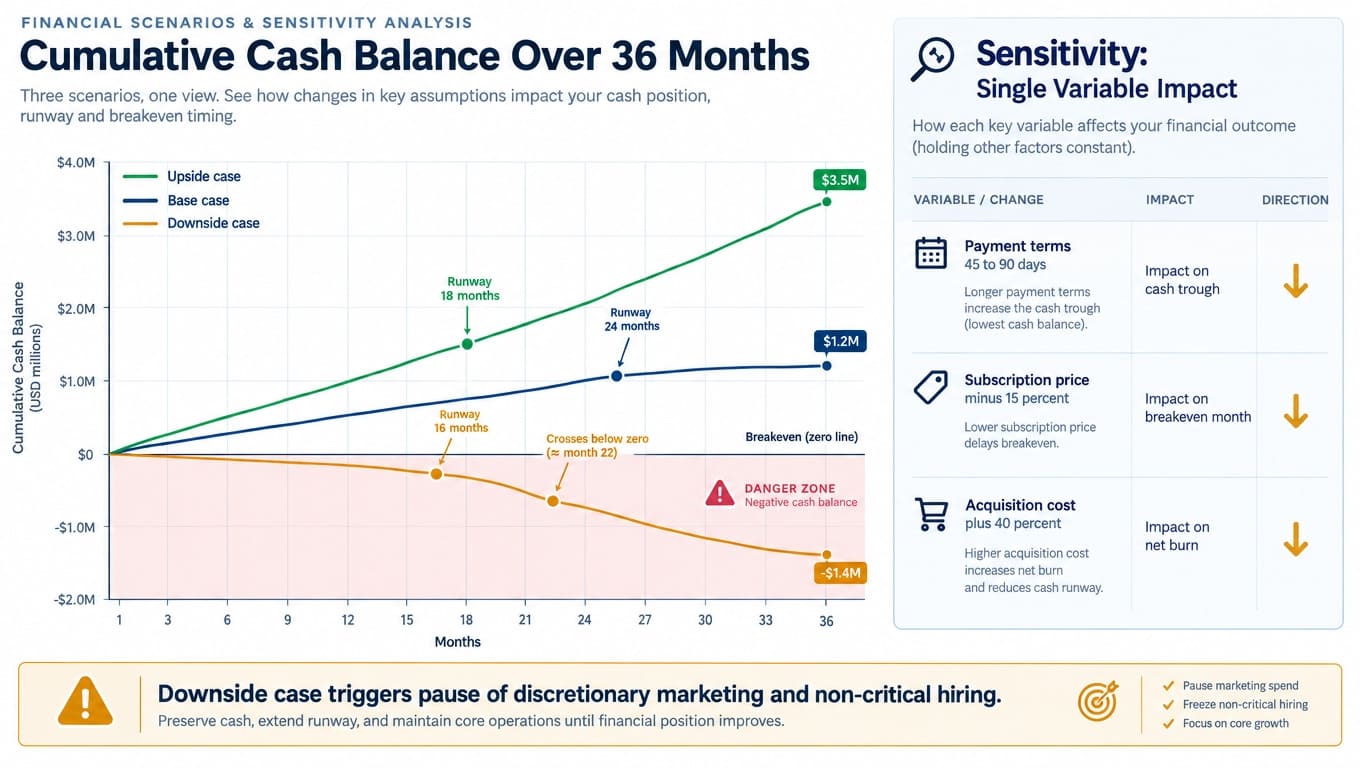
Create Base, Upside and Downside Cases
Business almost never tracks a single tidy forecast. Launches slip, the macro picture turns, and adoption can run hot or stall. A model built for backers meets that head-on through scenario work.
Lay out three structured operating cases:
- Base Case: the realistic path on management’s target assumptions, expected cycles, standard conversion, and planned hiring.
- Downside Case: a conservative stress test with real friction baked in — conversion down 30 percent, longer enterprise cycles, heavier churn, and acquisition costs up 25 percent.
- Upside Case: a faster trajectory with quicker adoption, stronger retention, and fatter margins, matched by the added support staff and infrastructure that growth demands.
Scenarios ought to steer real decisions, not just decorate the deck. The downside case should spell out which discretionary spends — marketing pushes, non-essential hires — get paused to stretch runway if the commercial targets slip.
Run Sensitivity Analysis
Where scenarios flex many assumptions at once, sensitivity analysis isolates how much your bottom line swings when a single variable moves.
With spreadsheet data tables, you can watch how shifts in one lever hit runway, the cash trough, and net profit:
- What becomes of working capital if enterprise clients stretch payment from 45 days to 90?
- How far does a 15 percent cut in subscription pricing push out the point of breakeven?
- What does net burn look like if acquisition cost jumps 40 percent as ad auctions heat up?
A model that buckles under mild stress will not survive diligence. Showing you grasp where the operation is fragile reassures backers about your grip on the business.
Tie each sensitivity straight to a pre-planned response — reopening supplier terms, easing off non-critical hiring — and you signal to backers that management is ready to guard the cash when conditions sour.
UAE-Specific Costs and Tax Assumptions to Include
Models built for companies trading in Dubai and across the Emirates have to reckon with the local regulatory setup, corporate tax rules, and regional running costs. Skip these and your capital requirement comes out skewed, inviting questions once diligence begins.
Weigh the following local drivers as you put the projections together:
- Corporate Tax: Federal corporate income tax runs at a standard 9 percent on taxable profit above AED 375,000. Do not read that AED 375,000 line as a free pass from compliance, filings, or tax registration. Firms inside Free Zones have to clear the Qualifying Free Zone Person (QFZP) bar and satisfy strict substance and qualifying-income tests to reach the preferential regime. Check every treatment against current Federal Tax Authority (FTA) rules or run it past a qualified tax adviser.
- Value Added Tax (VAT): A standard 5 percent VAT applies to taxable supplies of goods and services. Though VAT is an indirect tax and not your revenue, it still tugs on working capital. Model the timing of VAT you collect from customers, the input VAT you reclaim on purchases, and your settlement cycle with the FTA.
- Licensing and Free Zone Choice: Initial licences, yearly renewals, establishment cards, and municipality charges swing widely between mainland registration under the Department of Economy and Tourism (DET) and Free Zones such as DIFC, ADGM, DMCC, or DAFZA. Carry realistic recurring renewal costs rather than booking the licence once and forgetting it.
- Visas and Medical Sponsorship: Each hire in the Emirates carries statutory visa costs, Emirates ID processing, a medical fitness check, labour establishment fees, and mandatory health cover. Budget somewhere from AED 7,000 to AED 15,000 or more per head at hiring, renewable every two years.
- Office Space: A licence needs matching premises, physical or flexi-desk. Dubai leases tend to run on quarterly post-dated cheques, with deposits, fit-out spend, and yearly Ejari registration on top. Price these off real landlord quotes, not blanket industry averages.
- Currency: Anchor the base accounts in UAE Dirhams (AED). Where overseas backers or software costs call for US Dollar (USD) figures, apply the pegged rate of roughly 3.6725 AED to the dollar. Should you take payment or owe suppliers in other currencies such as EUR, GBP, or SAR, build separate FX schedules to capture conversion risk.
Leave out statutory overheads, visa renewals, or the working-capital drag from VAT settlement, and you understate the burn and set the company up to run short of money.
Financial Modeling Mistakes That Undermine Investor Confidence
Working through submissions, VC associates and credit managers hunt for structural slips and assumptions that do not hold water. Steering clear of the usual traps protects your standing through technical diligence.
- Hockey-Stick Growth With No Operational Link: flat revenue for six months, then a sudden vertical climb, with no matching spend on campaigns, sales staff, or delivery capacity to justify it.
- Zero or Below-Market Founder Pay: zeroing out founder salaries to flatter the margin. Backers expect market-rate founder pay, both for leadership stability and for an honest read on overheads.
- Statements That Do Not Talk to Each Other: a standalone P&L where cash flow is just net profit plus depreciation, blind to collection lags, inventory needs, and liability shifts on the balance sheet.
- Over-Long Horizons and False Precision: eight years of monthly detail for an early venture. The norm is monthly out to 24 to 36 months, then quarterly or annual roll-ups for years four and five.
- Hardcoded Cells: static numbers pasted into forward-looking cells instead of live links back to the assumptions sheet.
- Growth Pulled From Thin Air: acquisition costs dropping 80 percent while volume multiplies twentyfold, with no data, test record, or strategic logic behind it.
- Working-Capital Blind Spots: assuming customers pay the instant you invoice while suppliers wait 90 days, quietly burying a cash shortfall.
- One Lonely Scenario: an aggressive case with no downside and no sensitivity work, leaving backers guessing about how you handle risk.
Once the workbook is done, file it beside the deck, cap table, corporate registry papers, and commercial contracts. For how to pull the full package together for institutional review, study how to prepare an investor-ready data room in the UAE.
Financial Model Structure Best Practices: Final Checklist
Before the model goes out to backers, investment banks, or lending partners, run the workbook past these essentials:
- Assumptions Sheet: one dedicated tab holding every pricing, growth, salary, marketing, and working-capital variable, each with its source and notes.
- Live Formulas: every forward figure linked dynamically; no unverified hardcoded numbers lurking in calculation cells.
- Three-Statement Integration: P&L, cash flow, and balance sheet reconcile cleanly with the balance sheet showing zero variance.
- Bottom-Up Build: revenue grows out of granular funnels, lead channels, and real capacity, not a top-down slice of market share.
- Unit Economics: CAC, LTV, per-unit gross margin, and payback all derive from verifiable marketing and operating inputs.
- Local Accuracy: regional licensing, visa quotas, health cover, corporate tax, and VAT timing all sit in the expense schedules.
- Capital Requirement: the model pinpoints the exact cash trough, carries a working-capital cushion, and ties use of funds to milestones.
- Risk Testing: base, upside, and downside cases all run, backed by sensitivity tables on the variables that matter.
- Audit Readability: the workbook is tidy, colour-coded by cell type, and navigable by an outside analyst with no founder on hand to explain it.
With the model structurally sound and fully checked, you can walk into investor meetings on steady ground. To see how your projections slot into the wider equity story, read our comprehensive guide to raising startup funding in the UAE.
Crafting a model that holds up means balancing market strategy against disciplined accounting logic. If you want expert hands structuring a model fit for backers, stress-testing the projections, or lining up institutional support, reach out to Aser Capital for tailored fundraising support in the UAE, or ask for our validated model templates to speed the raise along.
Frequently Asked Questions
How far into the future should financial projections extend for an early-stage startup?
At the early stage, the norm is monthly detail across the first 24 to 36 months, then quarterly or annual roll-ups for years four and five. Pushing granular monthly figures out six to eight years invents false precision and chips away at backer confidence.
How do you calculate the exact amount of funding a startup needs to raise?
Find the deepest point of cumulative negative cash — the cash trough — in your integrated cash flow, and that marks the true requirement. Then add a sensible cushion of three to six months of operating costs to ride out slow payments or operational hiccups.
Why is a bottom-up revenue model preferred over a top-down market share approach?
Top-down figures just assume you grab some arbitrary slice of a market without showing how the business runs. A bottom-up build grows revenue from the actual mechanics — ad spend, acquisition funnels, average order values, sales-cycle length, and the limits of team capacity.
Should founders include their own compensation in the financial model?
Yes. Model founder pay at market rate rather than zeroing it out or lowballing it. Leaving it off flatters the margin and hides real operating costs, whereas backers want realistic pay that keeps leadership in place and the operation stable.
What specific employment and statutory overheads must be modeled for UAE hires?
Beyond base salary, models for Emirati hires have to carry visa issuance, Emirates ID processing, the medical fitness check, labour establishment fees, and mandatory health cover. These statutory costs usually land between AED 7,000 and AED 15,000 or more per person and come round again every two years.
How should UAE Corporate Tax and VAT be reflected in financial projections?
Set corporate tax at the standard 9 percent on taxable profit above AED 375,000, with Free Zone firms needing to meet the Qualifying Free Zone Person criteria to reach the preferential regime. Treat the 5 percent VAT as a working-capital timing matter spanning customer collections, input tax credits, and your settlement cycle with the tax authority.
Similar services




Recent Posts